

 Back
Perception, awareness and response to air quality among residents of the Kathmandu Valley
9 sep 2026
 Download PDF | 1 MB

Summary
Air pollution is considered as the major environmental and public health risk in the Kathmandu Valley. The air pollution in the valley is exacerbated by the valley’s bowl-shaped topography and temperature inversion which restricts the dispersion of the pollutants emitted by vehicles, road dust, construction activities, brick kilns, biomass and waste burning. Recent evidence indicates that the annual average concentration of fine particulate matter (PM2.5) in the Valley is almost 8 times higher than the World Health Organization guideline value, contributing to significant health, economic and social impacts. However, pollution monitoring alone cannot explain how residents perceive air quality, obtain information, protect themselves or respond. This report therefore examines public perception, awareness and responses to air pollution among residents of the Kathmandu Valley.
The Kathmandu Valley scores 43.1 out of 100 on the Air Quality Awareness Index. That places it in the band the methodology designates “low level, predominantly passive attitude.” The Valley sits near the top of that band without reaching the next.
The Index is a composite social indicator. It converts a population survey into a single 0–100 score describing how residents perceive air pollution, what they know about it, what they are prepared to support and what they actually do. It does not measure air quality. The study is based on 1,200 face-to-face interviews across Kathmandu, Lalitpur and Bhaktapur with residents aged 18 to 64, and follows the Methodological Guide for the Development and Application of the Air Quality Awareness Index and the OECD / JRC Handbook on Constructing Composite Indicators.
The survey shows that there is indeed a widespread concern for air pollution and its impact on health across the residents of the Valley, however, concern does not translate into knowledge to access information and willingness or action to combat air pollution. Perceptions were, however, geographically differentiated, with negative perception of local air quality particularly prominent in more densely urbanized areas of Kathmandu, Lalitpur and Bhaktapur. The affective dimension recorded the highest score at 67.0 out of 100, indicating strong concern about deteriorating air quality.
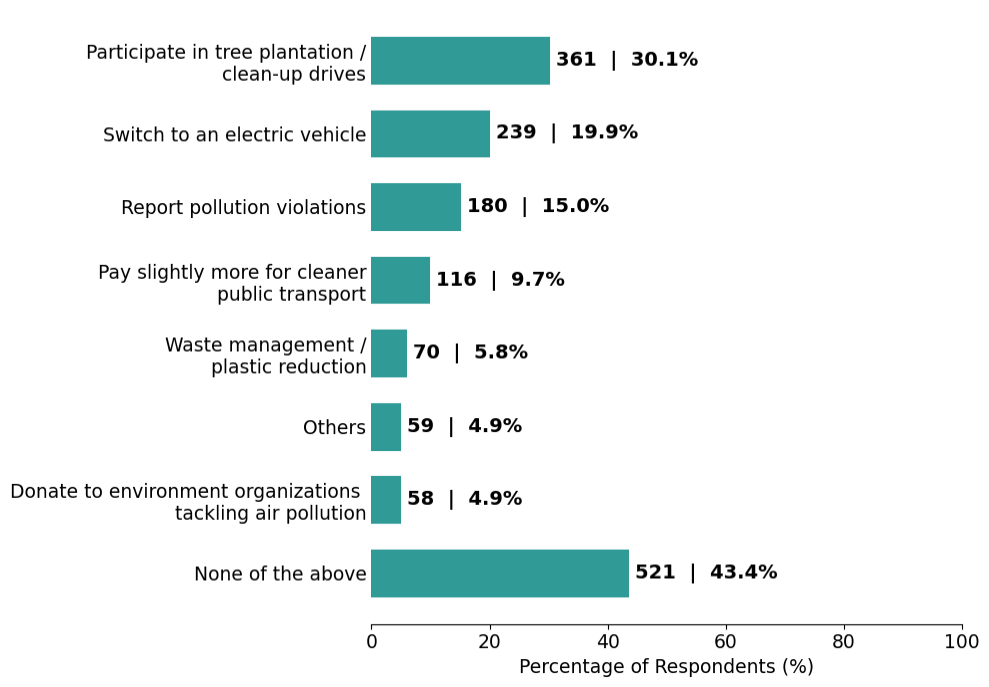
Despite strong concern, residents had limited knowledge of, access to and use of reliable air quality information. The cognitive dimension scored only 47.0 as 61.7% did not know how to check air quality and only 22.5% had ever checked air quality. Among those who had checked air quality, 94.1% relied on cues such as smell, visibility, surface dust and eye irritation. The findings indicated that the major challenge is not a lack of concern about air pollution but limited ability to access and understand the air quality data. With 53.1% rarely checking air quality through apps or websites, consuming reliable air quality information is not yet part of everyday decision making. With regard to sources of air pollution, respondents identified motor vehicles and traffic emissions as the major sources of air pollution; as a result, 19.9% are willing to switch to electric vehicles and 9.7% willing to pay more for cleaner transport. However, 70.5% of respondents expressed dissatisfaction with government efforts to combat air pollution.
The conative dimension scored 36.8 indicating limited readiness to undertake the actions requiring personal and financial commitments. Although respondents strongly supported structural measures such as improved public transport, electric mobility and dust control, they showed less support for measures that could increase their personal cost, while willingness to adopt individual actions was low. The action dimension recorded the lowest score at 21.7, reflecting limited participation in environmental activities. Respondents mainly relied on low- cost measures to reduce pollution exposure but use of more effective measures remained limited.
Air pollution also influenced some resident’s relocation decisions. About 39.1% of those who had considered moving from the valley identified poor air quality as a contributing factor, with temporary or seasonal relocation more common than permanent migration. The overall AQAI score was 43.1, indicating a clear gap between strong concern about air quality and resident’s knowledge to access reliable information, readiness to act and participate to combat air pollution. Overall, the findings indicate that residents recognize the seriousness of air pollution but face information, financial and institutional barriers that limit effective responses.
Chapter 1. Background
The Kathmandu Valley, home to over 3 million people, faces a severe and persistent air quality crisis that has become a defining environmental and public health challenge for Nepal. Situated at an average elevation of about 1,350 m and surrounded by hills rising to 2,000-2,800 m, the valley’s bowl-shaped topography naturally traps pollutants, restricting wind movement and creating conditions where emissions accumulate to extreme concentration levels, particularly during dry winter months. This geographical condition is compounded with a complex mix of various pollution sources: vehicles, biomass burning, open waste burning, brick kilns and industries, all contributing to the valley’s air pollution.
According to the World Bank (2025), the valley’s average annual PM2.5 concentration in the Kathmandu Valley reaches 37 µg/m3 – roughly seven to eight times the WHO annual guideline of 5 µg/m³. If no additional measures are implemented, this situation is projected to worsen considerably, with population-weighted PM2.5 exposure rising to 51 µg/m3 by 2035.
The burden is large. Long-term PM2.5 exposure in the Valley has been estimated to contribute to 8,900 premature deaths and 575,247 disability-adjusted life years annually, with an associated economic cost of around USD 1.25 billion – approximately 3% of national GDP (Adhikari et al., 2026). Air pollution is estimated to cut average life expectancy of residents living in Kathmandu district by 2.6 years relative to the WHO guideline scenario (AQLI, 2025).
Monitoring data does not capture how people perceive, adapt to or respond to that air. Saud and Paudel (2018) described a Valley whose “pristine blue hills and the crisp blue sky… now appear gray and hazy” – a lived experience concentration data cannot express. The gap matters practically: a kiln regulation the public does not understand is harder to enforce; a sensor network the public does not use, produces no exposure reduction; an emission-testing regime drivers read as a revenue exercise erodes compliance.
Effective air quality management requires not only air quality monitoring infrastructure but also an informed, engaged public capable of accessing, interpreting and acting on air quality data information. Without understanding how the public access the information, perceive the health risk and evaluate the policy intervention, communication strategies may fail to reach and behavior change may remain limited.
To bridge that gap, this report assesses public awareness of air quality in Kathmandu Valley using the multidimensional Air Quality Awareness Index (AQAI). The AQAI includes four dimensions: “affective” referring to concern and perceived health risk; “cognitive” referring to knowledge of air pollution, information sources and institutional responses; “conative” referring to intentions and willingness to support or adopt behavior change and “action” referring to reported protective and environment practices. The AQAI is a survey-based measure of public awareness and behavior and is distinct from conventional air quality index (AQI).
The valley now has seven reference-grade monitoring stations and an 18-sensor municipal network in Kathmandu Metropolitan City, with further deployment under way. The public health value of that infrastructure depends not on the number of instruments but on residents’ ability to access, understand, trust and act on what they report.
This report therefore sets out to assess perceived severity and health risk; evaluate access to and use of air quality information; examine awareness of institutional responses; document protective and adaptive behavior; establish a reproducible baseline Index for future waves; and translate the findings into recommendations for authorities.
Chapter 2. Data and method
2.1. Data collection
Fieldwork was conducted through face-to-face interviews using a standardized questionnaire, administered by a professional survey contractor; the sample comprises 1,200 respondents. The sample represents the valley’s adult population aged 18 to 64 by gender and by age, and covers all three districts of the valley, Kathmandu, Lalitpur and Bhaktapur, across nine residence zones.
The air quality awareness profile is constructed from four sub-indices measuring its key dimensions: affective (emotional perception of the threat), cognitive (knowledge and information), conative (attitudes and readiness to act) and active (actual practice).
The methodology follows the approaches set out in the Methodological Guide for the Development and Application of the Air Quality Awareness Index (Almaty Air Initiative, 2026) and, which in turn based on the Handbook on Constructing Composite Indicators (OECD / Joint Research Centre of the European Commission; Nardo et al., 2005). The Index measures social perception of environmental risk and does not substitute for environmental monitoring data.
2.2. Construction of the Index
The Index aggregates four dimensions of residents’ relationship to air pollution, ordered as a sequence: affective → cognitive → conative → active. Each dimension is scored on a scale from 0 to 100, and the final Index is calculated as the mean of the four sub-indices.
The final value is interpreted against the following scale:
| 0–25 | 26–50 | 51–75 | 76–100 |
|---|---|---|---|
| Extremely low | Low and predominantly passive | Medium concern and limited activity | High awareness and active behavior |
Interpreting the Index
The index measures the awareness and attitudes of the population, not the quality of the air. A higher value denotes a more developed perception of the problem, fuller knowledge of it, or more active behavior.
One rule of reading follows from this and applies throughout the sections below: on every indicator, the higher score is assigned to the response that demonstrates the higher level of awareness. On the rating of air quality in the area of residence, this means that a negative assessment scores higher than a positive one. A resident who rates the air as poor has registered the existence of a problem; a rating of “good” in conditions that exceed every health guideline means the problem has not been recognized.
A second rule concerns the final value. The Index is calculated as a simple mean of the four sub-indices, so the same total can correspond to different configurations of the dimensions. A value of 43 could arise from four evenly moderate sub-indices or, as in the present case, from a high affective dimension and an extremely low active one. The substantive information lies in the structure of the profile rather than in the total alone. Chapter 3 therefore examines the sub-indices separately, and Chapter 4 examines each dimension in turn.
Chapter 3. Overall assessment of AQAI score
3.1. The value of the Index
The final value of the Index for the Kathmandu Valley is 43.1 points out of 100.
This corresponds to the category “low level, predominantly passive attitude”. The valley sits at the upper boundary of that range without reaching the zone of “pronounced concern with limited activity” (51–75). The four sub-indices set out in the table below give the complete picture.
| Dimension | Mean score | Interpretation |
|---|---|---|
| Affective | 67.0 | Strong concern about air pollution and its hazards |
| Cognitive | 47.0 | Moderate or limited practical knowledge to access air quality information |
| Conative | 36.8 | Limited/ low readiness to support collective actions to improve air quality |
| Action | 21.7 | Limited/low participation in action to improve air quality |
| AQAI score | 43.1 | Low level and predominantly passive attitude |
The profile declines monotonically along the sequence from perception of the threat through knowledge and readiness to action.
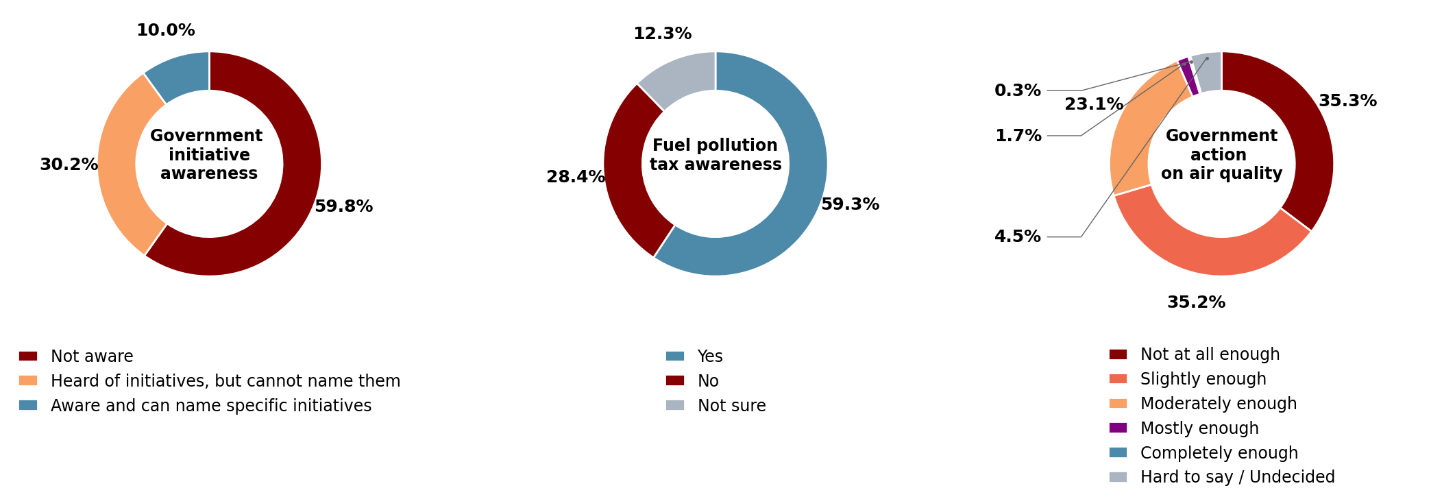
There is a gap of 20.0 points from emotional perception of the threat (affective) to knowledge and information (cognitive). This means that emotional perception of the problem is often not supported by knowledge: most concerned residents (61.7%) do not know where to check air quality, and 59.8% are unaware of any government initiative on air quality, with 10.0% able to name one.
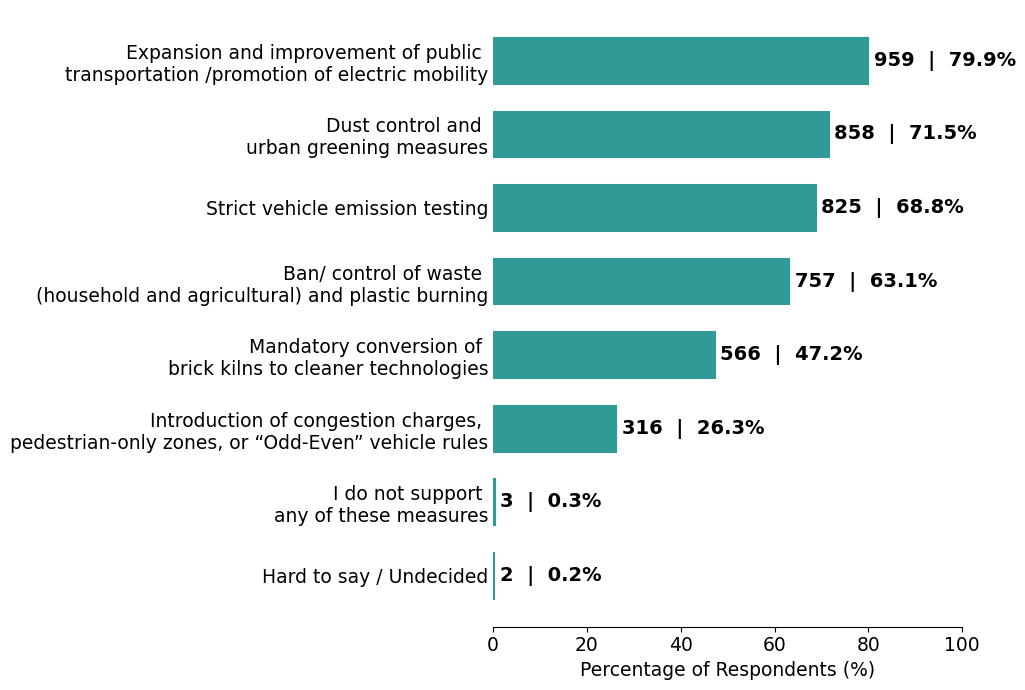
The gap between knowledge and information (cognitive) to readiness to act (conative) is 10.2 points. This is the smallest decline within the profile of the index. Available knowledge converts into declared attitudes at reasonable efficiency. This, for example, is reflected by 79.9% of residents supporting the expansion of public transport and electric mobility.
From readiness directly to action (active) is a loss of 15.1 points (from 36.8 to 21.7). Declared readiness is not realized in practice: 43.4% of respondents report doing nothing personally to improve air quality, 53.0% took no environmental action over the past year, and 53.1% of residents consult air quality rarely, every few months.
The difference between the affective and active dimensions is 45.3 points, which is the defining characteristic of the current position. A high level of concern about air pollution (67.0) is not accompanied by a comparable level of practical action on the part of residents (21.7).
3.2. Interpretation of the profile
The structure of the profile supports three principal conclusions, examined in greater detail in the sections that follow.
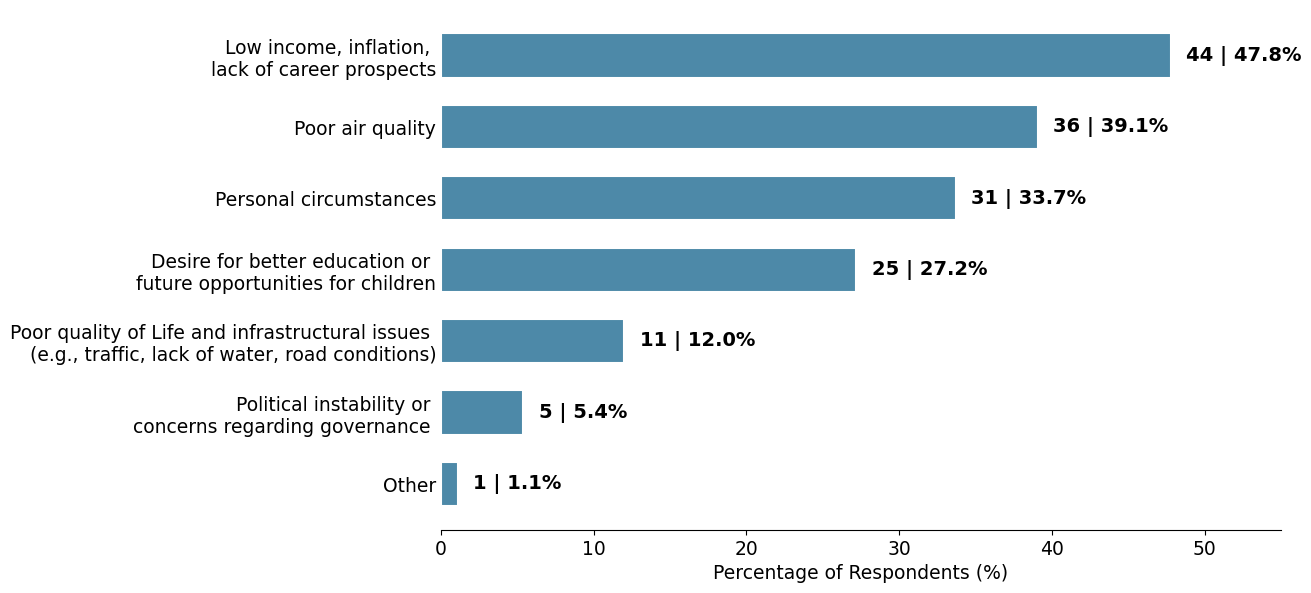
First, the deficit in awareness arises not from an absence of interest in the problem but from a shortage of practical information. The affective dimension is the only component situated in the medium-high zone: most residents perceive air pollution as a serious threat to health, with 81.2% rating it hazardous or extremely hazardous, and among respondents considering the possibility of moving away from the Valley, 39.1% identify air quality as a reason for that decision, second only to economic pressure at 47.8% (Chapter 4). The problem is therefore already perceived as significant and potentially dangerous. At the same time, a high level of concern is not accompanied by sufficient information about the causes of pollution, the available sources of data, or the possible means of response.
Second, the principal constraints are concentrated in the cognitive and active dimensions. The low value of the cognitive sub-index is driven largely by weak awareness of the means of checking air quality and of existing initiatives. Perceptions of the sources of pollution are more fully formed, although the results indicate substantial distortions in that perception: when unprompted, 61.8% of residents name motor vehicles as the main cause, while 0.75% name brick kilns and none name household biomass combustion, both of which published source apportionment studies identify as among the valley’s largest contributors. The low value of the active sub-index reflects the infrequent consultation of air quality data, limited use of protective measures and low engagement in environmental action.
Third, a high level of concern coexists with limited knowledge and practical action. The gap between the affective and active dimensions is 45.3 points: the affective sub-index reaches 67.0, while the active sub-index is only 21.7. This indicates a substantial divergence between the perception of the air pollution problem and the actual level of involvement in actions to address it. Where access to intelligible and usable sources of information is limited, perceptions of the problem are shaped heavily by personal experience and informal communication channels: among residents who have checked air quality, 94.1% have relied on direct sensory observation and 87.4% on social media, while official data reaches 17.0% of that group and 3.8% of the Valley as a whole (Chapter 4.2). This reliance on informal and sensory information, with high level of concern but low level of action, suggest that residents view air pollution primarily as a systemic problem requiring effective government intervention, rather than one they feel empowered to solve through individual behavior.
Chapter 4. Survey findings
4.1. Affective dimension
The affective dimension recorded the highest mean score of 67.0, reflecting strong emotional concern about the seriousness and health implication of air pollution among residents.
“I am concerned about my own and my family’s health as pollution is increasing.”
– Female, 18-24 age
“Since I have to work outdoors, I have personally experienced the dust, smoke, waste, and pollution. The air quality is very poor.”
-Male, 18-24 age
4.1.1. Perceived air quality and health concerns
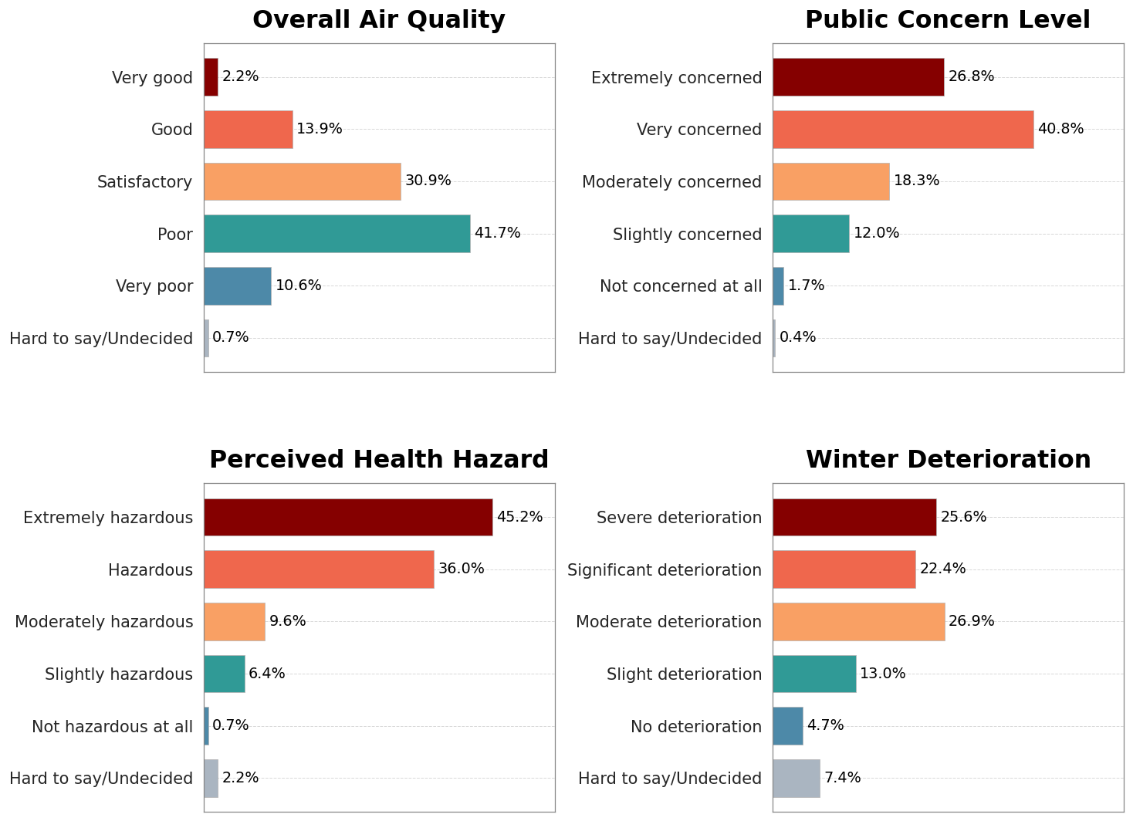
More than half of the respondents (52.3%) rated their local air quality as “poor to very poor”. Concern about visible pollution was even higher with 67.5% reporting that they were “very” to “extremely” concerned about dust/haze. 81.2% of respondents perceived air pollution as “hazardous” to “extremely hazardous” to health (Figure 4.1). This high level of concern across all the age groups and among parents and non-parents and was similarly strong among economically vulnerable households and more affluent groups. This suggests that air pollution is perceived as a shared environmental and health crisis rather than an issue only affecting a particular segment of the population.
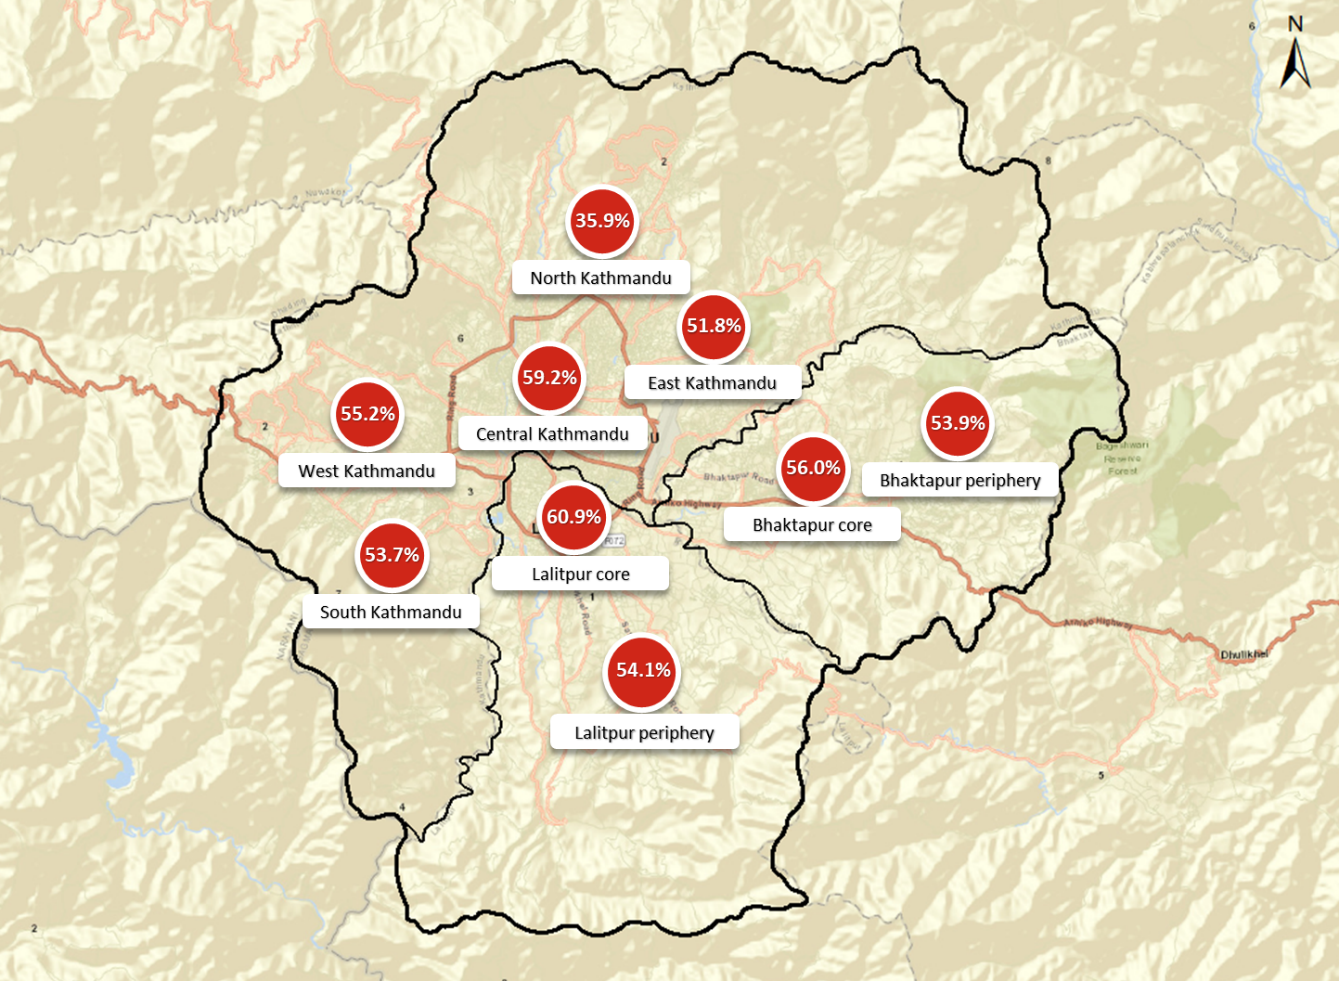
However, the perception of air quality varied across geographic locations within the valley as shown in Figure 4.2. Negative perception on air quality was concentrated in the core urban areas of Lalitpur (60.9%), Kathmandu (59.2%) and Bhaktapur (56.0%), while North Kathmandu reported substantially lower negative perception (35.9%) reflecting its relatively greener and less densely urbanized setting. These respondents from North Kathmandu also specifically associated better environmental conditions because of forest areas, greenery and lower density of settlements.
This negative perception is not limited to local residents. A tourist perception survey conducted in Kathmandu in 2005 found that 69% rated the valley’s air quality as poor while 77% believed conditions were better outside the valley (The Energy and Resource Institute, 2019), reporting breathing difficulty and mountain visibility problems during their stay, a primary draw for tourists. Despite the fact that for 77% of tourists visiting Nepal, a good view of the mountains is the most important factor, 68% of tourists believe that visibility has decreased in Nepal. More recently, a Wageningen University study on tourist perception on visibility in Nepal similarly found that respondents rated Kathmandu’s air quality lower, with one visitor noting “since mid-80s the air quality in Kathmandu Valley has nosedived” (Hoek, 2015). While tourist assessment reflects a temporary aesthetic form of exposure than the chronic health driven concern captured among the residents in this study, these findings corroborate that Kathmandu Valley’s air quality has been a persistent problem for a long time and that it is affecting the economy as well. This also indicates that awareness is not the bottleneck but real gaps lie in translating that concern into knowledge, policy and action which is explained in later sections.
4.1.2. Seasonal perception of air quality
Perceptions of worsening air quality were particularly evident with regard to the winter season. Nearly 48.0% of respondents perceived significant to severe deterioration in air quality during the winter season compared to the rest of the year in Kathmandu Valley. Residents’ perceived air quality during winter as worse is partly explained by the fact that reduced visibility is more noticeable at that time of the year coupled with Kathmandu’s fog. This perception is consistent with the valley’s winter atmospheric conditions. Temperature inversion can reduce the vertical mixing and traps the pollutants near to the surface contributing to elevated pollution concentration and reduced visibility. However, reduced visibility is not necessarily a result of or an indication of severe air pollution alone. Winter fog, mist and other meteorological conditions can reduce visibility and residents may therefore find it difficult to distinguish between air pollution related haze or normal winter fog. This illustrates that winter visibility may have been interpreted differently by different residents with some attributing it to natural meteorological phenomena while others associate it with increasing pollution.
4.2. Cognitive dimension
The cognitive dimension recorded a moderate mean score of 47.0 out of 100, indicating resident knowledge and practical understanding of air quality information are only moderate despite high level of concern.
“Very dusty roads, smoky vehicles, and nearby brick and asphalt factories near the Nakhu River cause pollution.”
-Male,25-34 age
“Pollution is higher during the dry season because there is no rainfall, forest fires are more common, and brick kilns are also in operation during this time.”
-Female, 45-54 age
4.2.1. Knowledge and awareness of access to air quality information
Although many respondents recognize that the valley’s air pollution is a serious problem, the majority lack the practical knowledge needed to access the air quality information. 61.7% reported that they did not know how to check air pollution levels and only 22.5% had ever checked air quality (Figure 4.3). Furthermore, knowledge of how to check air quality is directly associated with the level of education. Only 10.8% with primary education or below reported knowing how to check air quality compared with 63.0% of those with master’s degrees or higher knowing how to check air quality data. This gradient indicates a significant educational disparity in access to information. Digital access to air quality information is concentrated among younger residents who already check it: of the 18–24-year-olds who had checked air quality, 60.3% had used a website and 42.5% a mobile app. Across the whole 18–24 age band, however, these correspond to 14.1% and 10.0%, since most young residents do not check air quality at all.
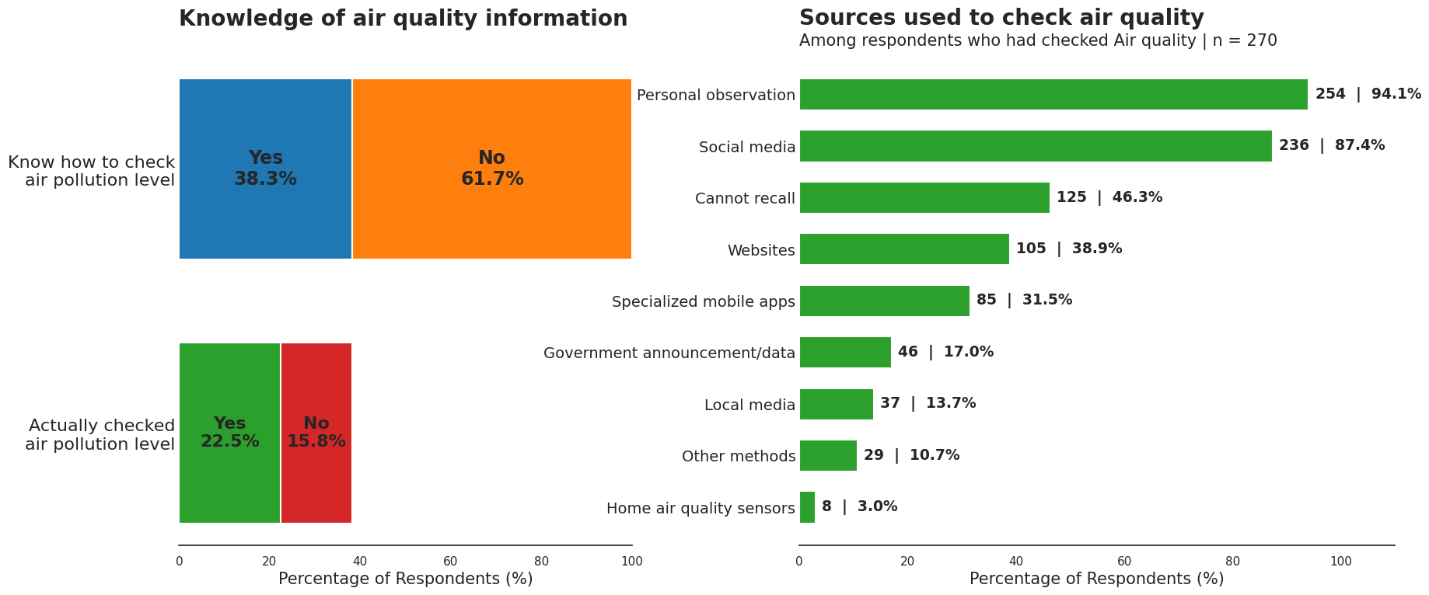
Among those who had checked air quality, personal observation was the most commonly reported method, with 94.1% reporting reliance on sensory cues such as smell, visibility, eye irritation and dust on surfaces. Research shows that people often assess air quality through visual and sensory experiences (Song et al., 2024). While this sensory observation provides an immediate and intuited assessment especially during high pollution events, it cannot reliably identify or measure their concentration or determine the associated health risk. While sensory perception can be treated as an important trigger for concern, it cannot be a substitute for accessible and trusted air quality data. This reliance on physical observation reflects limited awareness of access to monitoring platforms rather than a lack of concern about pollution in general. Improving public access to clear and easy to understand air quality information is therefore essential to help residents make informed decisions about exposure. It is interesting to note that reliance on digital media such as apps, websites and social media to access air quality information declined with age. Website use was highest among 18-24 (60.3%) and declined to (21.2%) among 35-44 age groups, while social media use decreased from 90.4% to 62.5% across the youngest and oldest age groups. In contrast, older respondents were increasingly unable to recall which sources they used to check the air quality. So, we need to develop age inclusive air quality communication mechanisms with digital platforms prioritized for younger age groups and simpler and more accessible information channels for older age groups.
4.2.2. Awareness of sources of air pollution
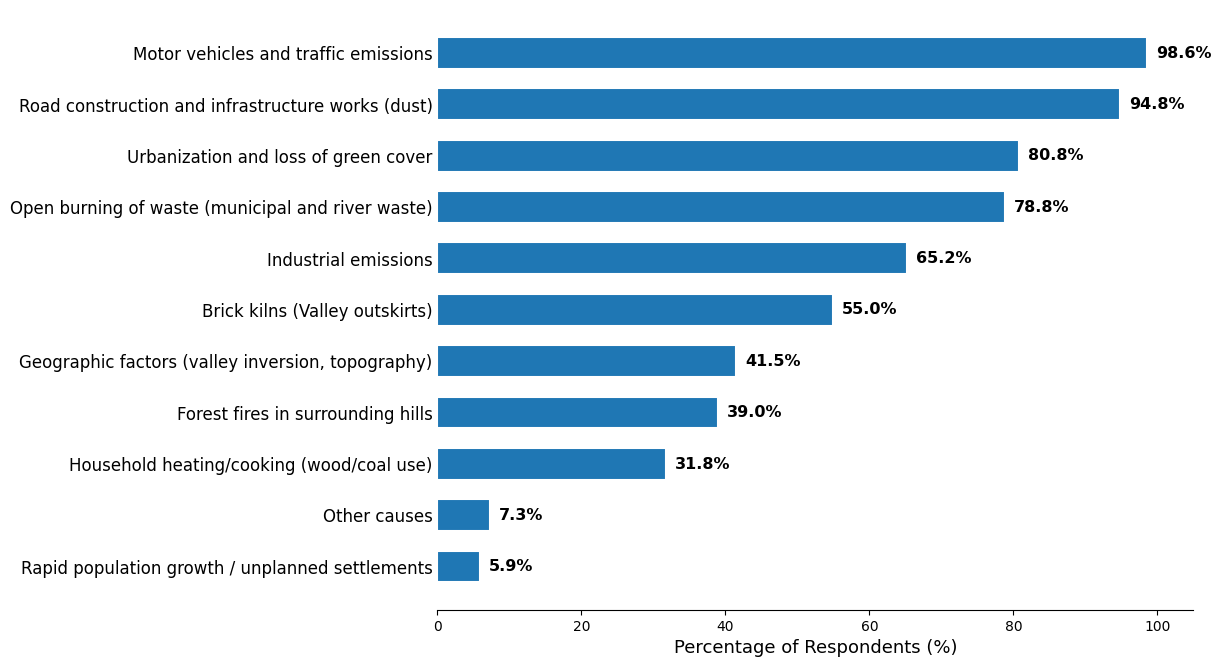
Motor vehicles and traffic emissions were the most perceived source of air pollution in the Kathmandu Valley by 98.6% respondents, followed by dust from road construction and infrastructure works (94.8%) (Figure 4.4). Awareness of emission from brick kilns varied by the resident’s location. Respondents living in peripheral areas closer to brick kilns operators were more likely to identify brick kilns as a source of air pollution than respondents in other areas with fewer or no brick kilns, particularly central Kathmandu. This suggests that proximity to emission sources influences resident’s awareness of local sources of air pollution. These perceptions broadly align with Kathmandu Valley studies identifying vehicle emission, dust, biomass and waste burning and brick kiln as the important contributors to particulate pollution (Islam et al., 2020, 2022).
4.2.3 Awareness of government initiatives
Awareness of institutional responses to combat air pollution and improve air quality was also limited among respondents. More than half of respondents (59.8%) reported no awareness of government air quality initiatives. At the same time, 59.3% were aware of the fuel-related pollution tax. Although this tax could be a key part of government action on air pollution, it does not appear to be widely recognized as such. Awareness was particularly high among motorcycle users:70.6% reported awareness of the fuel tax, which may reflect their regular experience with the cost of fuel. However, awareness does not necessarily translate into trust in government actions. The majority of respondents (70.5%) reported dissatisfaction with government intervention to combat air pollution. This may reflect a gap in communication, visibility and/or the adequacy of government action itself.
4.3. Conative dimension
The conative dimension recorded a low mean score of 36.8 out of 100, indicating that although residents express substantial concern, their readiness to engage in or commit towards cleaner air is limited.
“Old vehicles should be replaced with electric vehicles to reduce vehicle emissions and dust.”
-Male, 45-54 age
4.3.1. Support for institutional measures to combat air pollution
Support was strongest for visible, collective measures that address pollution: Four in five respondents (79.9%) supported improving and expanding public transport and electric mobility, while 71.5% supported dust-control measures and urban greening and 68.8% for strict vehicle emission testing. This pattern is consistent with the respondent reporting traffic emission and dust as the major sources of pollution. In contrast, support was lower for measures that directly affect daily mobility or impose additional financial burden such as congestion charges, pedestrian only zones or odd-even vehicle rules (26.3%).
4.3.2. Personal readiness to combat air pollution
Despite strong support for public measures, that support did not translate into personal readiness to act (Figure 4.7). When asked which actions they were personally prepared to improve air quality, 43.4% selected none, meaning they were not willing to participate in any measures to combat air pollution. Participation in tree plantation or clean-up drives was the most commonly selected individual action (30.1%), likely because these activities are accessible and visible environmental action. This also corroborates with the residents of North Kathmandu perceiving greener areas as having better local air quality. Also, even where residents may be willing to support cleaner transport and emission control, in principle, they are less willing to endorse measures that could increase personal cost i.e., only 19.9% respondents were willing to switch to an electric vehicle, 9.7% reported willingness to pay more for cleaner transport and 4.9% were willing to donate to environmental activities. This may be partly because these personal actions require financial commitments, which may vary according to respondent’s financial circumstances. Such as one’s readiness to switch to an electric vehicle more than doubled from 15.9% among the financially constrained households to 36.1% among households reporting no major constraints. Similarly, the percentage of people who are open to paying more for cleaner transport quadrupled from 5.2% to 20.2%, while interest in donating increased from 2.4% to 11.8%. This is in line with a concept of higher income households having a higher marginal willingness to pay for cleaner air (Ito & Zhang, 2016).
4.5. Action dimension
Action dimension resulted in a very low 21.7 out of 100 indicating that limited participation in actions that are intended to address or protect themselves from air pollution.
“I wear a mask to protect myself from dust and smoke, and I do not go outside my home or office very often.”
-Male, 18-24 age
4.5.1. Protective measure to reduce pollution exposure
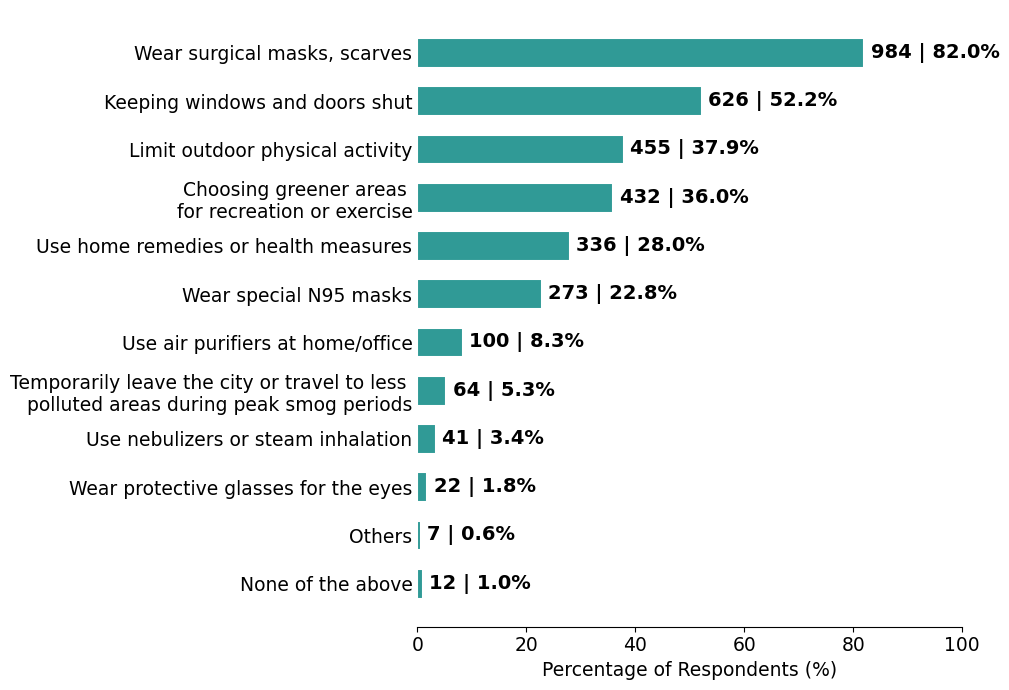
Residents frequently reported taking low and/or no-cost measures to reduce exposure to polluted air. 82.0% used surgical masks, scarfs or similar face covering, while 52.2% reported keeping windows and doors closed and 37.9% limited outdoor activities during pollution periods. These show that residents are not passive in response to poor air quality but their choice of protective measures tend to be more into accessible things that can be adopted at individual level. Only 22.8% reported using N95 masks despite their higher PM2.5 efficiency of 70% compared with 39% for surgical masks and 13% for cloth masks under tested conditions (Neupane et al., 2023). Also, across all transport modes, commuters predominately use surgical masks, scarfs and cloth masks due to their affordability, reusability and availability, as reported in Shakya et al. (2016). Furthermore, N95 masks usage was higher among walkers (32.4%) than among motorcycle users (18.4%) indicating comparatively high-risk awareness of exposure against air pollution. Use of higher cost protective measures particularly air purifiers, varied by financial status, with reported use from 1.8% among financially constrained households to 10.1% among no major financial constrained.
4.5.2. Engagement in environmental actions
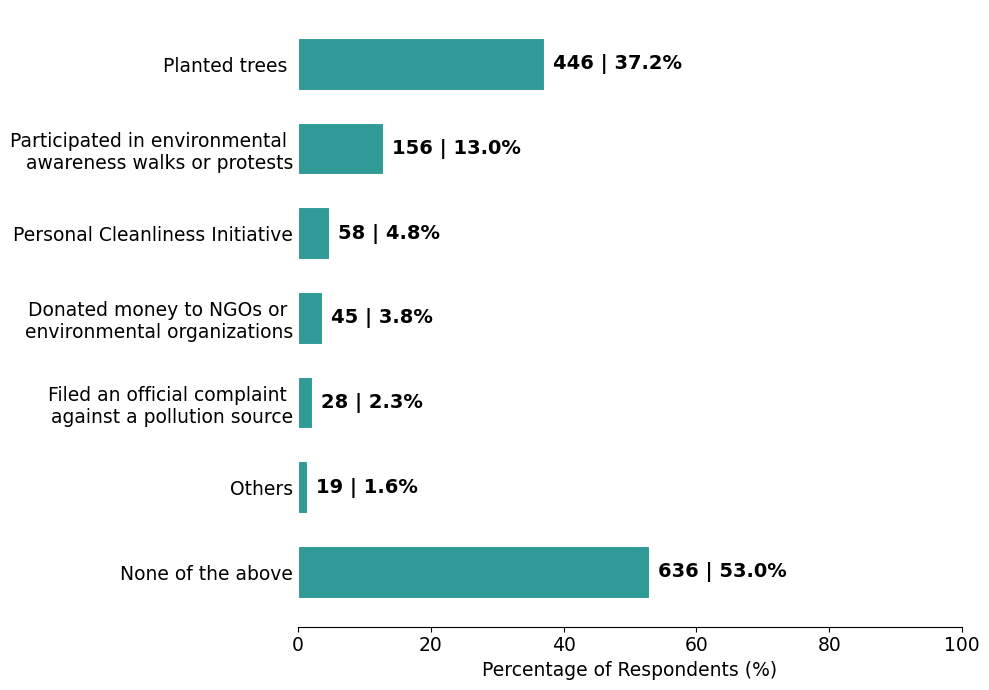
There was limited engagement among the residents to improve air quality as depicted in Figure 4.9. When respondents were asked about environmental action they have taken in the past year, 53.0% reported that they did not engage in any environmental actions. Tree planting was the most common activity (37.2%) followed by participation in environmental awareness walks or protest (13.0%). The prominence of tree planting is consistent with their perception that greener areas are cleaner and their willingness to improve air quality by taking actions which are tangible and measurable.
4.6. Migration due to air pollution
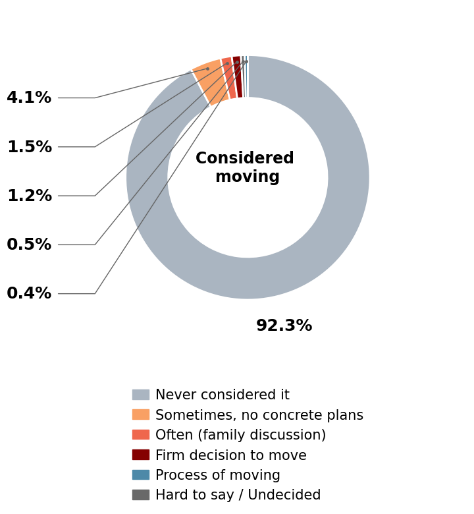
The survey also captured residents’ plans and reasons for migration from the Kathmandu Valley. Although most respondents (92.3%) had never considered leaving Kathmandu Valley,7.3% still considered moving.
Poor air quality was reported as a reason for considering migration by 39.1% of those who had considered moving. Interestingly, this was slightly lower than the proportion (47.8%) who wanted to leave due to economic pressures.
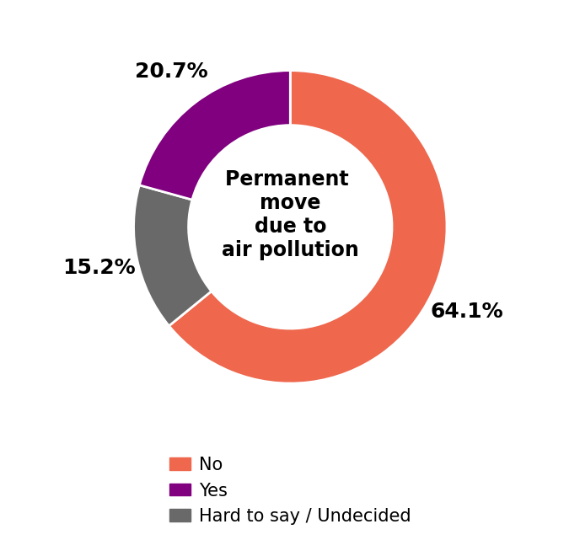
Among these respondents willing to move from the valley, 20.7% would consider a permanent move due to air pollution.
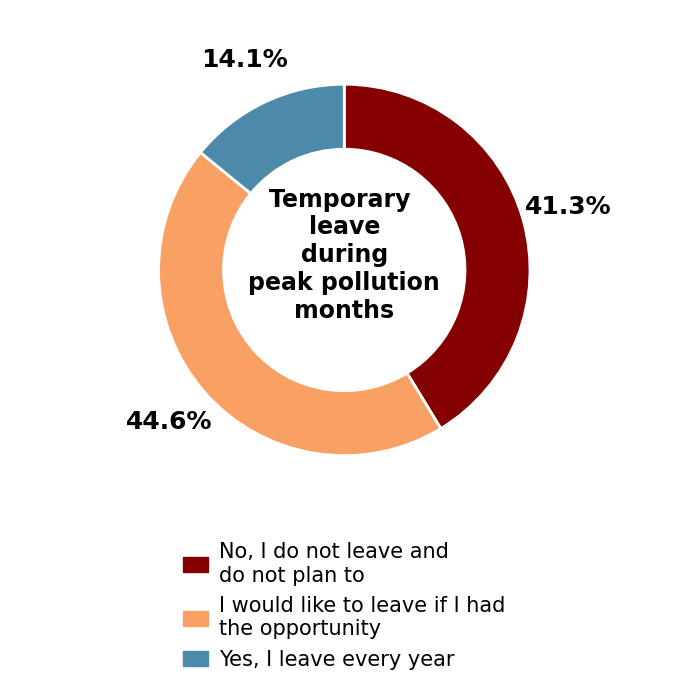
When asked about the intention of temporarily moving out of the valley during the peak pollution months, a gap emerged between the desire to leave and the actual ability to leave. While 41.3% of people do not leave or plan to leave, the majority of respondents (44.6%) would consider leaving temporarily during peak pollution periods if they had the opportunities such as sufficient financial resources and work from home arrangements. Only 14.1% actually leave every year. This indicates that air pollution is more often a driver of temporary/seasonal migration than permanent relocation.
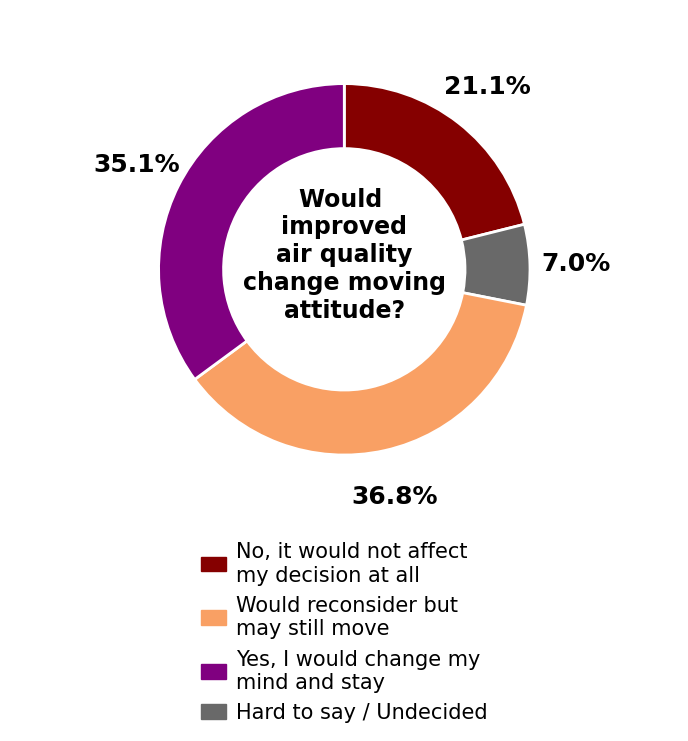
Among the respondents who were considering leaving the valley due to air pollution, 35.1% said that they would change their mind and stay if the air quality of air significantly improves, while 36.8% said they would still consider moving from the valley. This indicates that air pollution may be influencing more decisions than merely health concerns due to daily exposure, as it may also be shaping decisions of people about their future in the Kathmandu Valley. So, improving air quality may therefore be important not only for safeguarding resident’s health but also for enhancing overall quality of life and potentially reducing migration.
Chapter 5. Conclusion
The survey shows that the residents of the valley associate the polluted air with health risks, haze, dust and physical discomfort and they identified traffic emission and dust as the major sources. The high level of concern found in the survey shows that the seriousness of air pollution is widely recognized by the public. However, recognizing a problem is different from having the capacity and willingness to act. Many residents take protective steps using face coverings, reducing outdoor activities and keeping windows and doors closed to reduce exposure. These are no-cost or budget friendly options but less effective in preventing exposure. While more protective options such as N95 or air purifiers remain less used. The survey also highlights challenges in access to information relating to air quality and governance. Many did not know how to check air quality or had never done so, even though they know how to; they largely rely on sensory cues rather than reliable information. However, air can be polluted even when it appears to be visually clean. At the same time, limited awareness of government initiatives and dissatisfaction suggest that policy actions are not producing any visible impacts.
Information on air quality is most useful when it does more than report a number: it must help people understand the risk and identify the realistic action they can take. As stated above, air pollution also has implications on one’s life, beyond health alone. For some, it contributes to their intentions to temporarily move during peak pollution months and in some cases permanent relocation from Kathmandu Valley. This affects the overall living standard of the residents and their satisfaction with their life in the valley. The overall AQAI score of 43.1 indicates the challenge is therefore not simply to raise awareness, but to improve access to and use of air quality information so that existing concern can be translated into informed decision and effective action.
Recommendations
The current system requires residents to seek out air quality information, yet the majority do not know how to check it and only a small fraction, especially younger age groups, use apps/websites. Furthermore, the low usage of government portals indicates that official information channels are not reaching the majority of the population. This must shift from a “pull” system, where residents must find data to a “push” system, where data reaches them, ensuring easy access and understandable format irrespective of any group and clear guidance on what actions to take.
The survey found the disparity in knowledge of how to check air quality being strongly associated with education. So, authorities should develop age-appropriate air quality curriculum to ensure they develop knowledge and skills to monitor air quality, understand health risks and adopt the protective behaviors from an early age.
Policy makers should introduce incentives to make effective protective measures such as N95 masks and air purifiers, affordable and accessible to all. This includes subsidizing N95 masks, providing tax incentives to those who supply protective equipment and establishing voucher programs to help low-income households purchase air purifiers at reduced cost.
While digital platforms for reporting pollution violations exist, their usage remains low and older residents are significantly less likely to use apps or websites. The government should promote and launch an age-appropriate awareness campaign covering both digital and non-digital reporting channels. In addition, a transparent and timely feedback loop should be ensured so that complainants are informed of action taken, thereby building trust in the system’s effectiveness.
The survey revealed a critical gap between concern and action. The government in partnership with civil societies should design a behavior change communication strategy that converts concern into action.
References
Adhikari, S., Rattanapan, C., Laosee, O., Thapa, S., Acharya, S. R., Saud, B., Sriram, S., & Bhatta, J. (2026). Health and economic costs attributable to ambient air pollution levels in the Kathmandu Valley, Nepal. Discover Public Health, 23(1). https://doi.org/10.1186/s12982-026-02083-x
Almaty Air Initiative (2026). Methodological guide for the development and application of the Air Quality Awareness Index [Unpublished manuscript].
AQLI. (2025). Nepal Fact Sheet: Air Quality Life Index. The University of Chicago. Energy Policy Institute
Hoek, S. van de. (2015). Visibility in Nepal from a tourist s ’ perspective.
Islam, M. R., Jayarathne, T., Simpson, I. J., Werden, B., Maben, J., Gilbert, A., Praveen, P. S., Adhikari, S., Panday, A. K., Rupakheti, M., Blake, D. R., Yokelson, R. J., Decarlo, P. F., Keene, W. C., & Stone, E. A. (2020). Ambient air quality in the Kathmandu Valley, Nepal, during the pre-monsoon: Concentrations and sources of particulate matter and trace gases. Atmospheric Chemistry and Physics, 20(5), 2927–2951. https://doi.org/10.5194/acp-20-2927-2020
Islam, M. R., Li, T., Mahata, K., Khanal, N., Werden, B., Giordano, M. R., Praveen Puppala, S., Dhital, N. B., Gurung, A., Saikawa, E., Panday, A. K., Yokelson, R. J., Decarlo, P. F., & Stone, E. A. (2022). Wintertime Air Quality across the Kathmandu Valley, Nepal: Concentration, Composition, and Sources of Fine and Coarse Particulate Matter. ACS Earth and Space Chemistry, 6(12), 2955–2971. https://doi.org/10.1021/acsearthspacechem.2c00243
Ito, K., & Zhang, S. (2016). Willingness to Pay for Clean Air : Evidence from Air Purifier Markets in China.
Nardo, M., Saisana, M., Saltelli, A., Tarantola, S., Hoffman, A., & Giovannini, E. (2005). Handbook on constructing composite indicators: Methodology and user guide. OECD / Joint Research Centre of the European Commission. https://doi.org/10.1787/533411815016
Neupane, P. R., Bajracharya, I., & Khatry, S. B. (2023). Effectiveness of Inexpensive Cloth Facemasks and Their Amendments to Reduce Ambient Particulate Exposures: A Case of Kathmandu, Nepal. Journal of Environmental and Public Health, 2023, 1–10. https://doi.org/10.1155/2023/5144345
Saud, B., & Paudel, G. (2018). The Threat of Ambient Air Pollution in Kathmandu, Nepal. Journal of Environmental and Public Health, 2018. https://doi.org/10.1155/2018/1504591
Shakya, K. M., Noyes, A., Kallin, R., & Peltier, R. E. (2016). Evaluating the efficacy of cloth facemasks in reducing particulate matter exposure. Journal of Exposure Science and Environmental Epidemiology, 352–357. https://doi.org/10.1038/jes.2016.42
Song, W., Kwan, M. P., & Huang, J. (2024). Assessment of air pollution and air quality perception mismatch using mobility-based real-time exposure. PLoS ONE, 19(2 February), 1–24. https://doi.org/10.1371/journal.pone.0294605
The Energy and Resource Institute. (2019). Scoping Study for South Asia Air Pollution. https://assets.publishing.service.gov.uk/media/5cf0f3b0e5274a5eb03386da/TERI_Scoping_Study_final_report_May27_2019.pdf
World Bank. (2025). Towards clean air Nepal: Benefits, Pollution Sources, and Solutions.